CATV404-2-2
Parent Cluster: CATV404-2
Molecular dynamics trajectory
This section shows the MD trajectory of the cathepsin–GAG complex.
MD is a deterministic method allowing calculations of molecular trajectories in phase space. It relies on the numerical solution of classical Newtonian equations of motion.
Time-dependent molecular movement visualization.
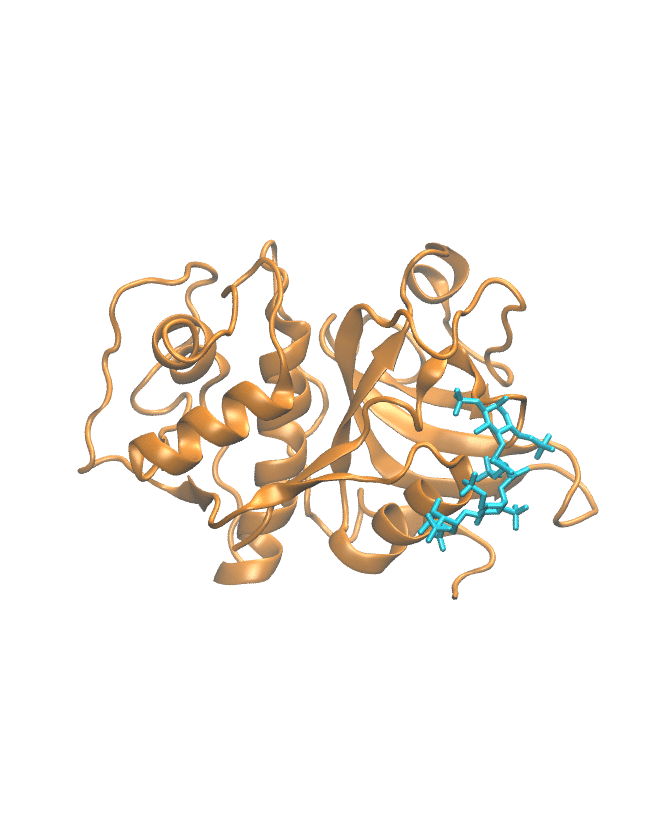
Structure of complex in PDB format
This section provides the structural model of the selected representative cathepsin–GAG complex.
The PDB file contains atomic coordinates of the selected representative complex and can be downloaded for further visualization or analysis.
Initial structural model of this clustered representative in standard PDB format.
Root mean square deviation of atomic positions
This section shows how much the protein or GAG structure changes relative to a reference structure during the simulation.
RMSD is the measure of similarity between the structures, defined as sets of atomic coordinates. The lower the RMSD value is, the more similar the corresponding structures are.
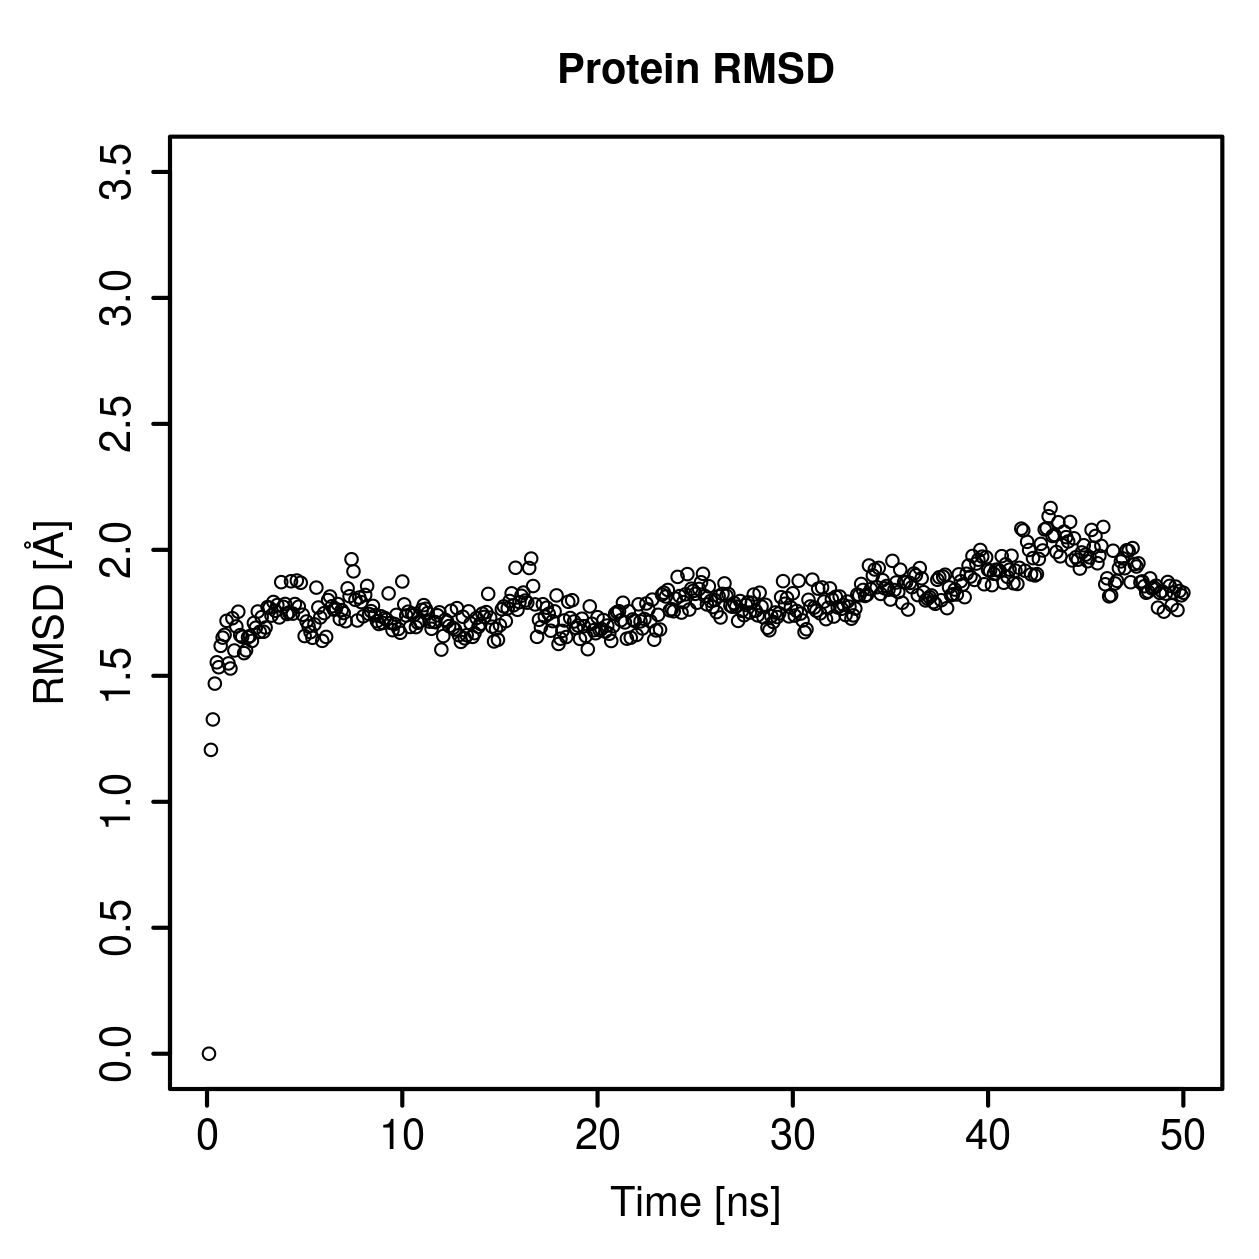
Protein Backbone RMSD Profile
Download protein RMSD CSV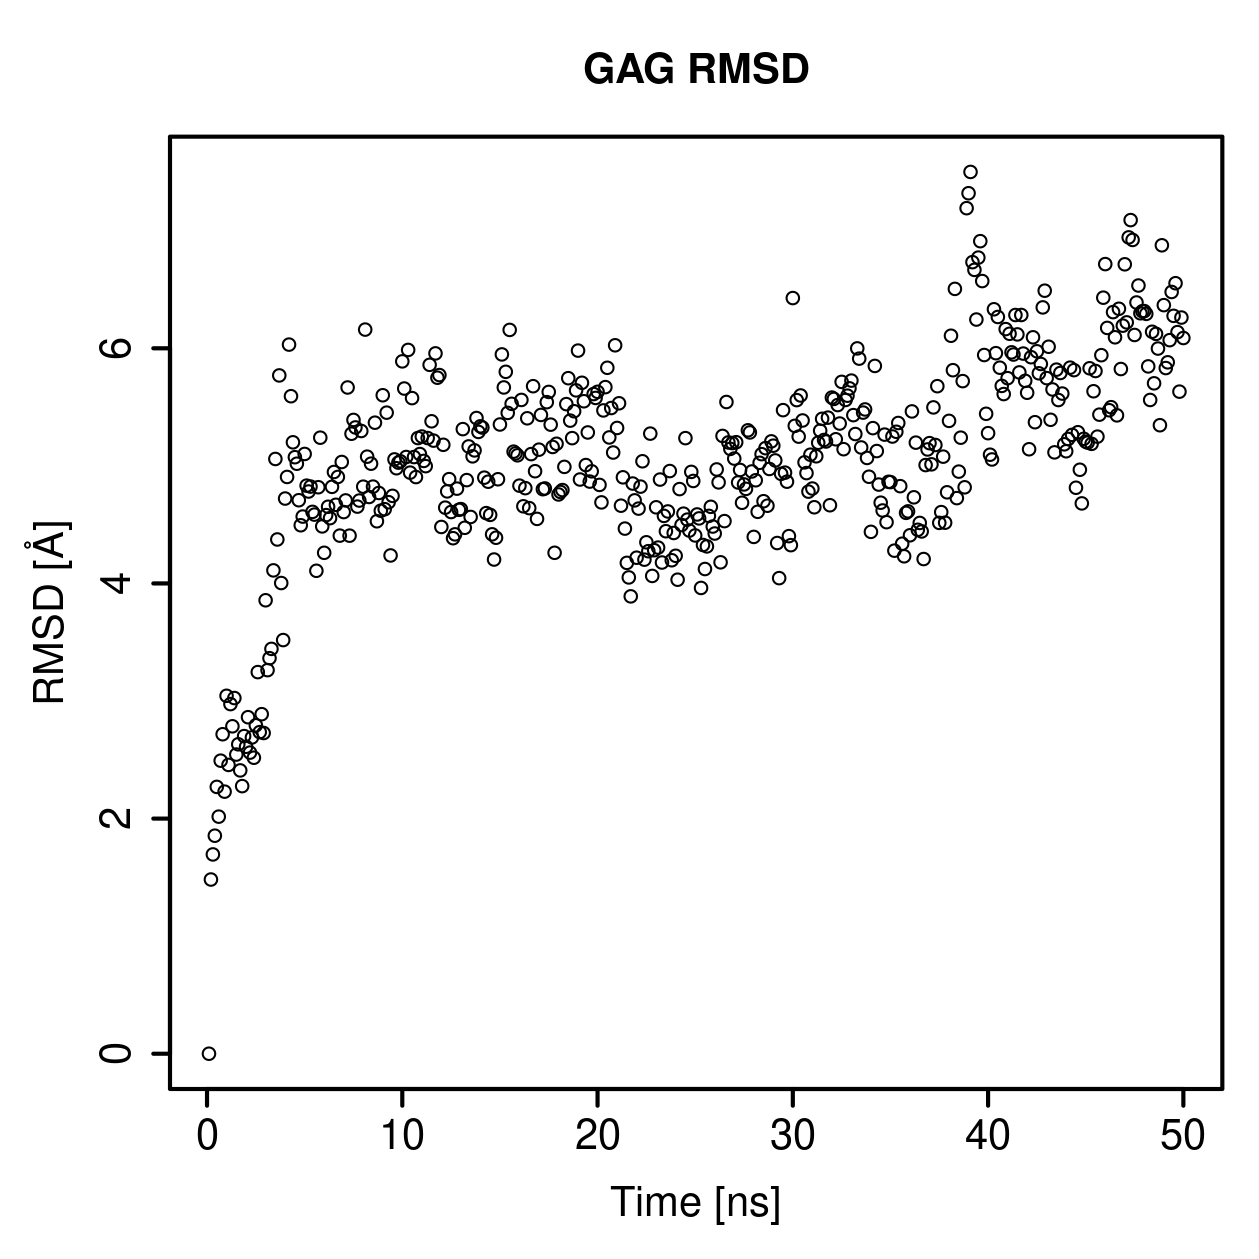
GAG Ligand RMSD Profile
Download GAG RMSD CSVMolecular mechanics with generalized Born and surface area solvation
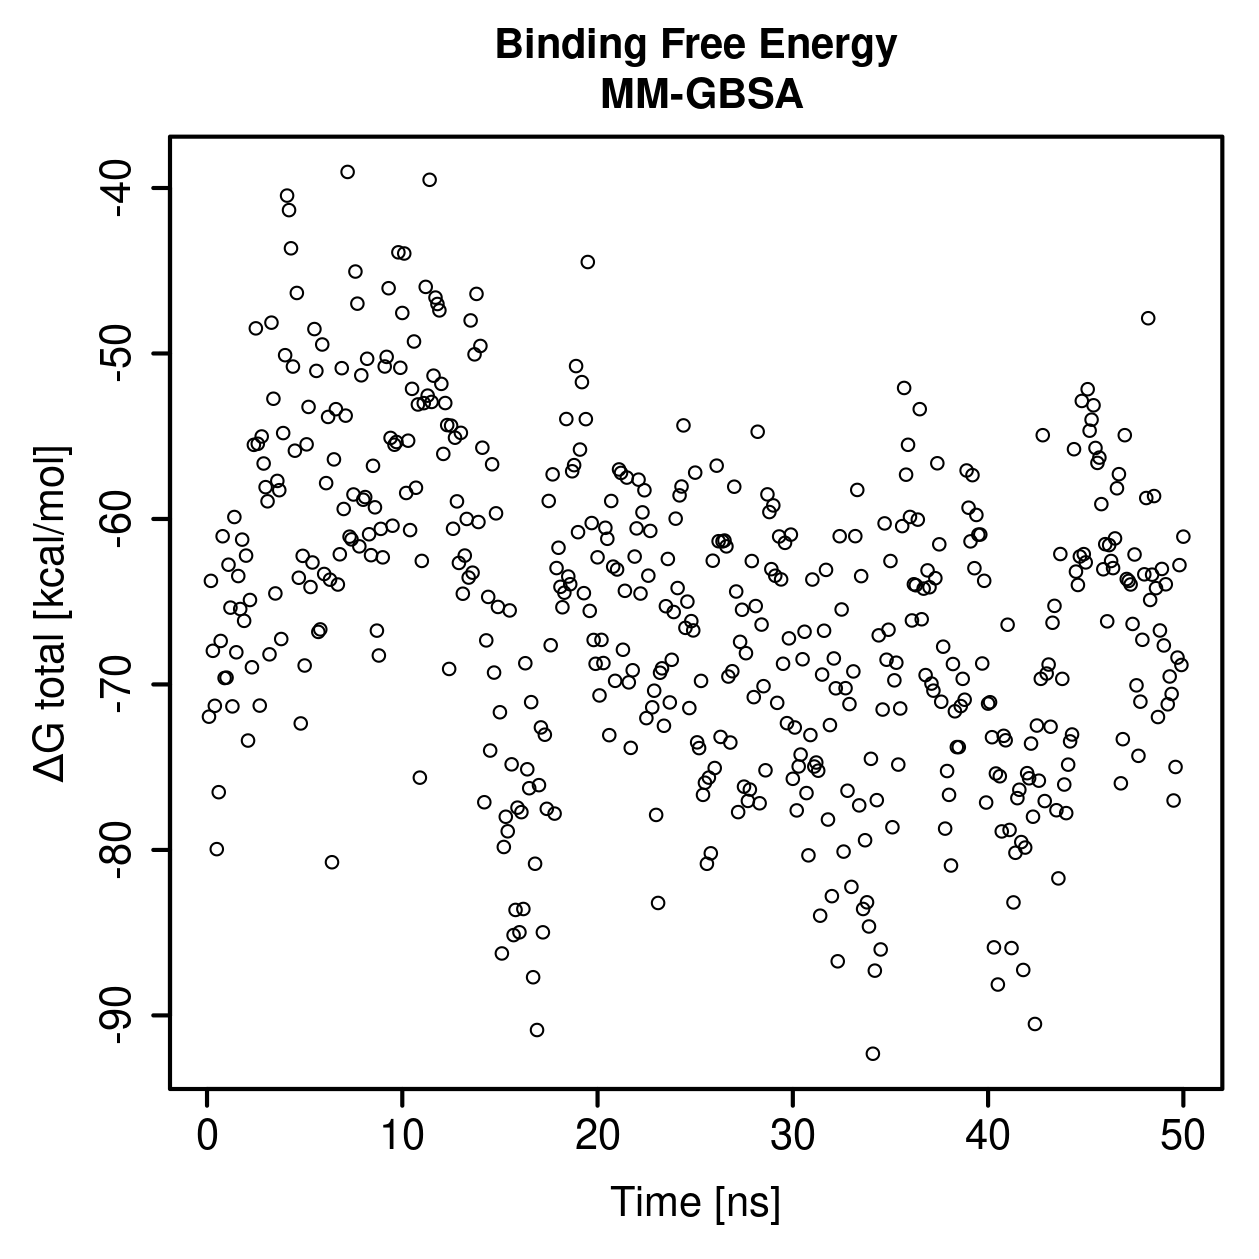
This section shows an approximate binding free-energy estimate for the selected cathepsin–GAG representative.
MM-GBSA is a free energy calculation method accounting for the interactions with solvent in implicit form, applied to the minimized structures from the molecular dynamics trajectory.
MM-GBSA values should be interpreted qualitatively and comparatively. They should not be treated as direct experimental binding affinities.
MM-GBSA energy components
This table shows the energetic terms contributing to the estimated MM-GBSA binding free energy.
The energy component table reports van der Waals, electrostatic, polar solvation, non-polar solvation and total estimated binding free-energy contributions where available.
| Energy Component | Value ± Std Dev [kcal/mol] |
|---|---|
| ΔGVDW (Van der Waals) | -45.2 ± 2.5 |
| ΔGEEL (Electrostatic) | -128.5 ± 5.2 |
| ΔGEGB (Generalized Born) | 110.1 ± 3.2 |
| ΔGESURF (Non-polar Surface) | -6.1 ± 0.5 |
| ΔGTOTAL (Binding Free Energy) | -69.6 ± 3.9 |
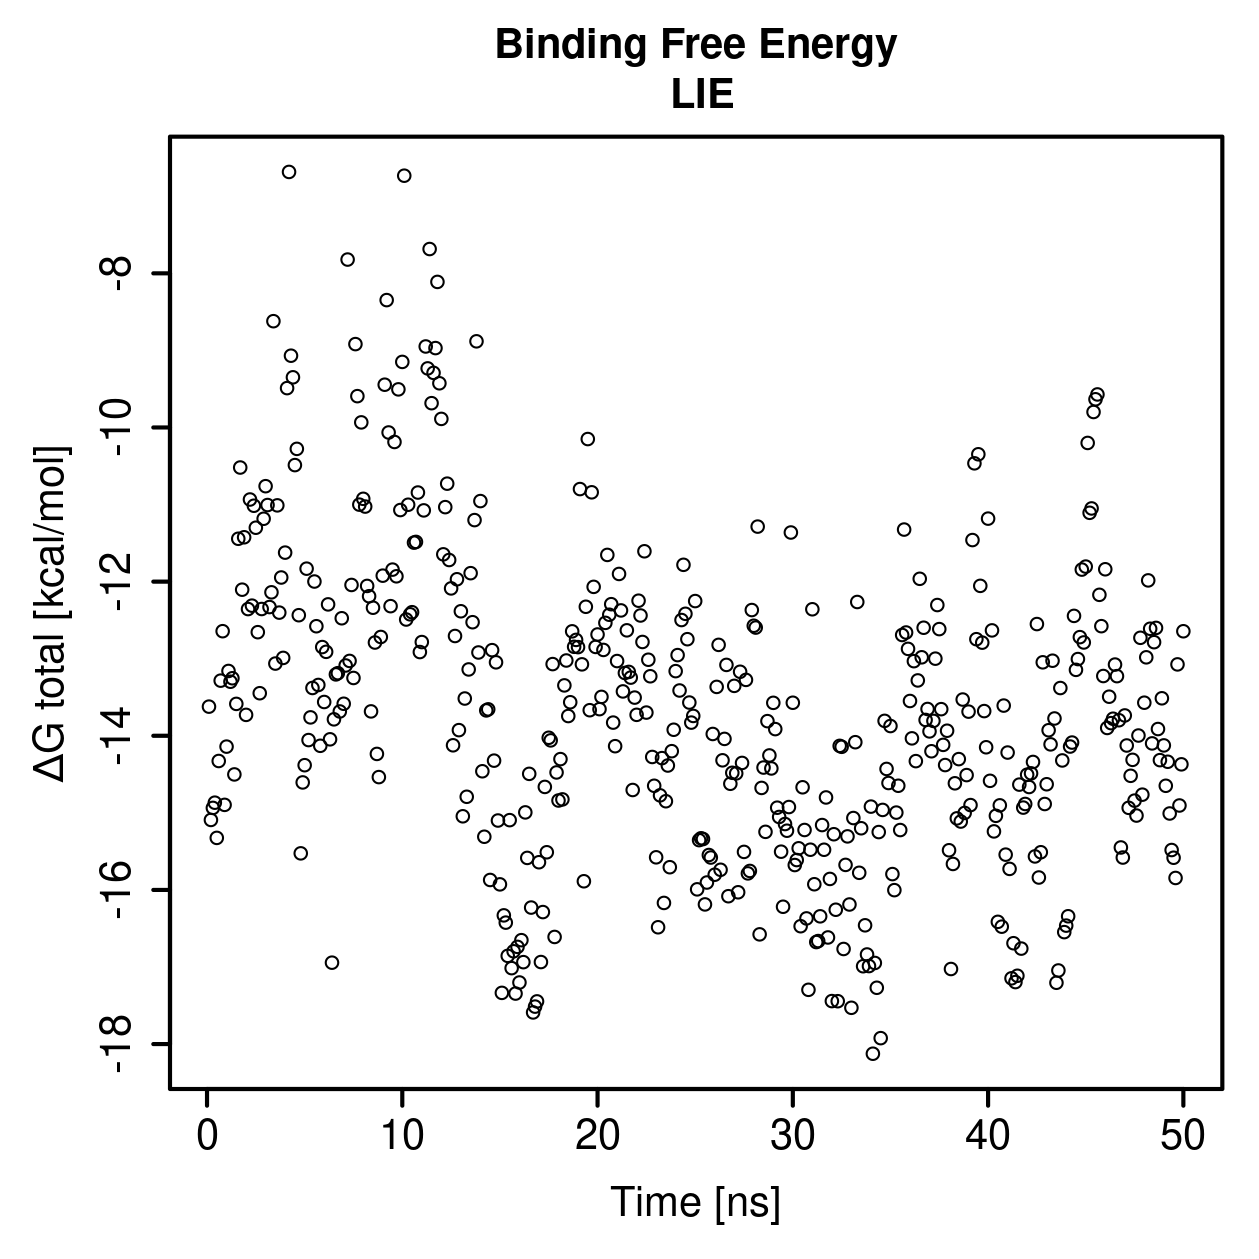
Linear interaction energy
This section shows an additional interaction-energy descriptor calculated directly from the molecular dynamics trajectory.
LIE is a free energy calculation method taking into account only electrostatic, isotropically scaled, and van der Waals interactions directly from the molecular dynamics trajectory.
LIE values should be interpreted as comparative simulation-derived descriptors, not as direct experimental binding affinities.
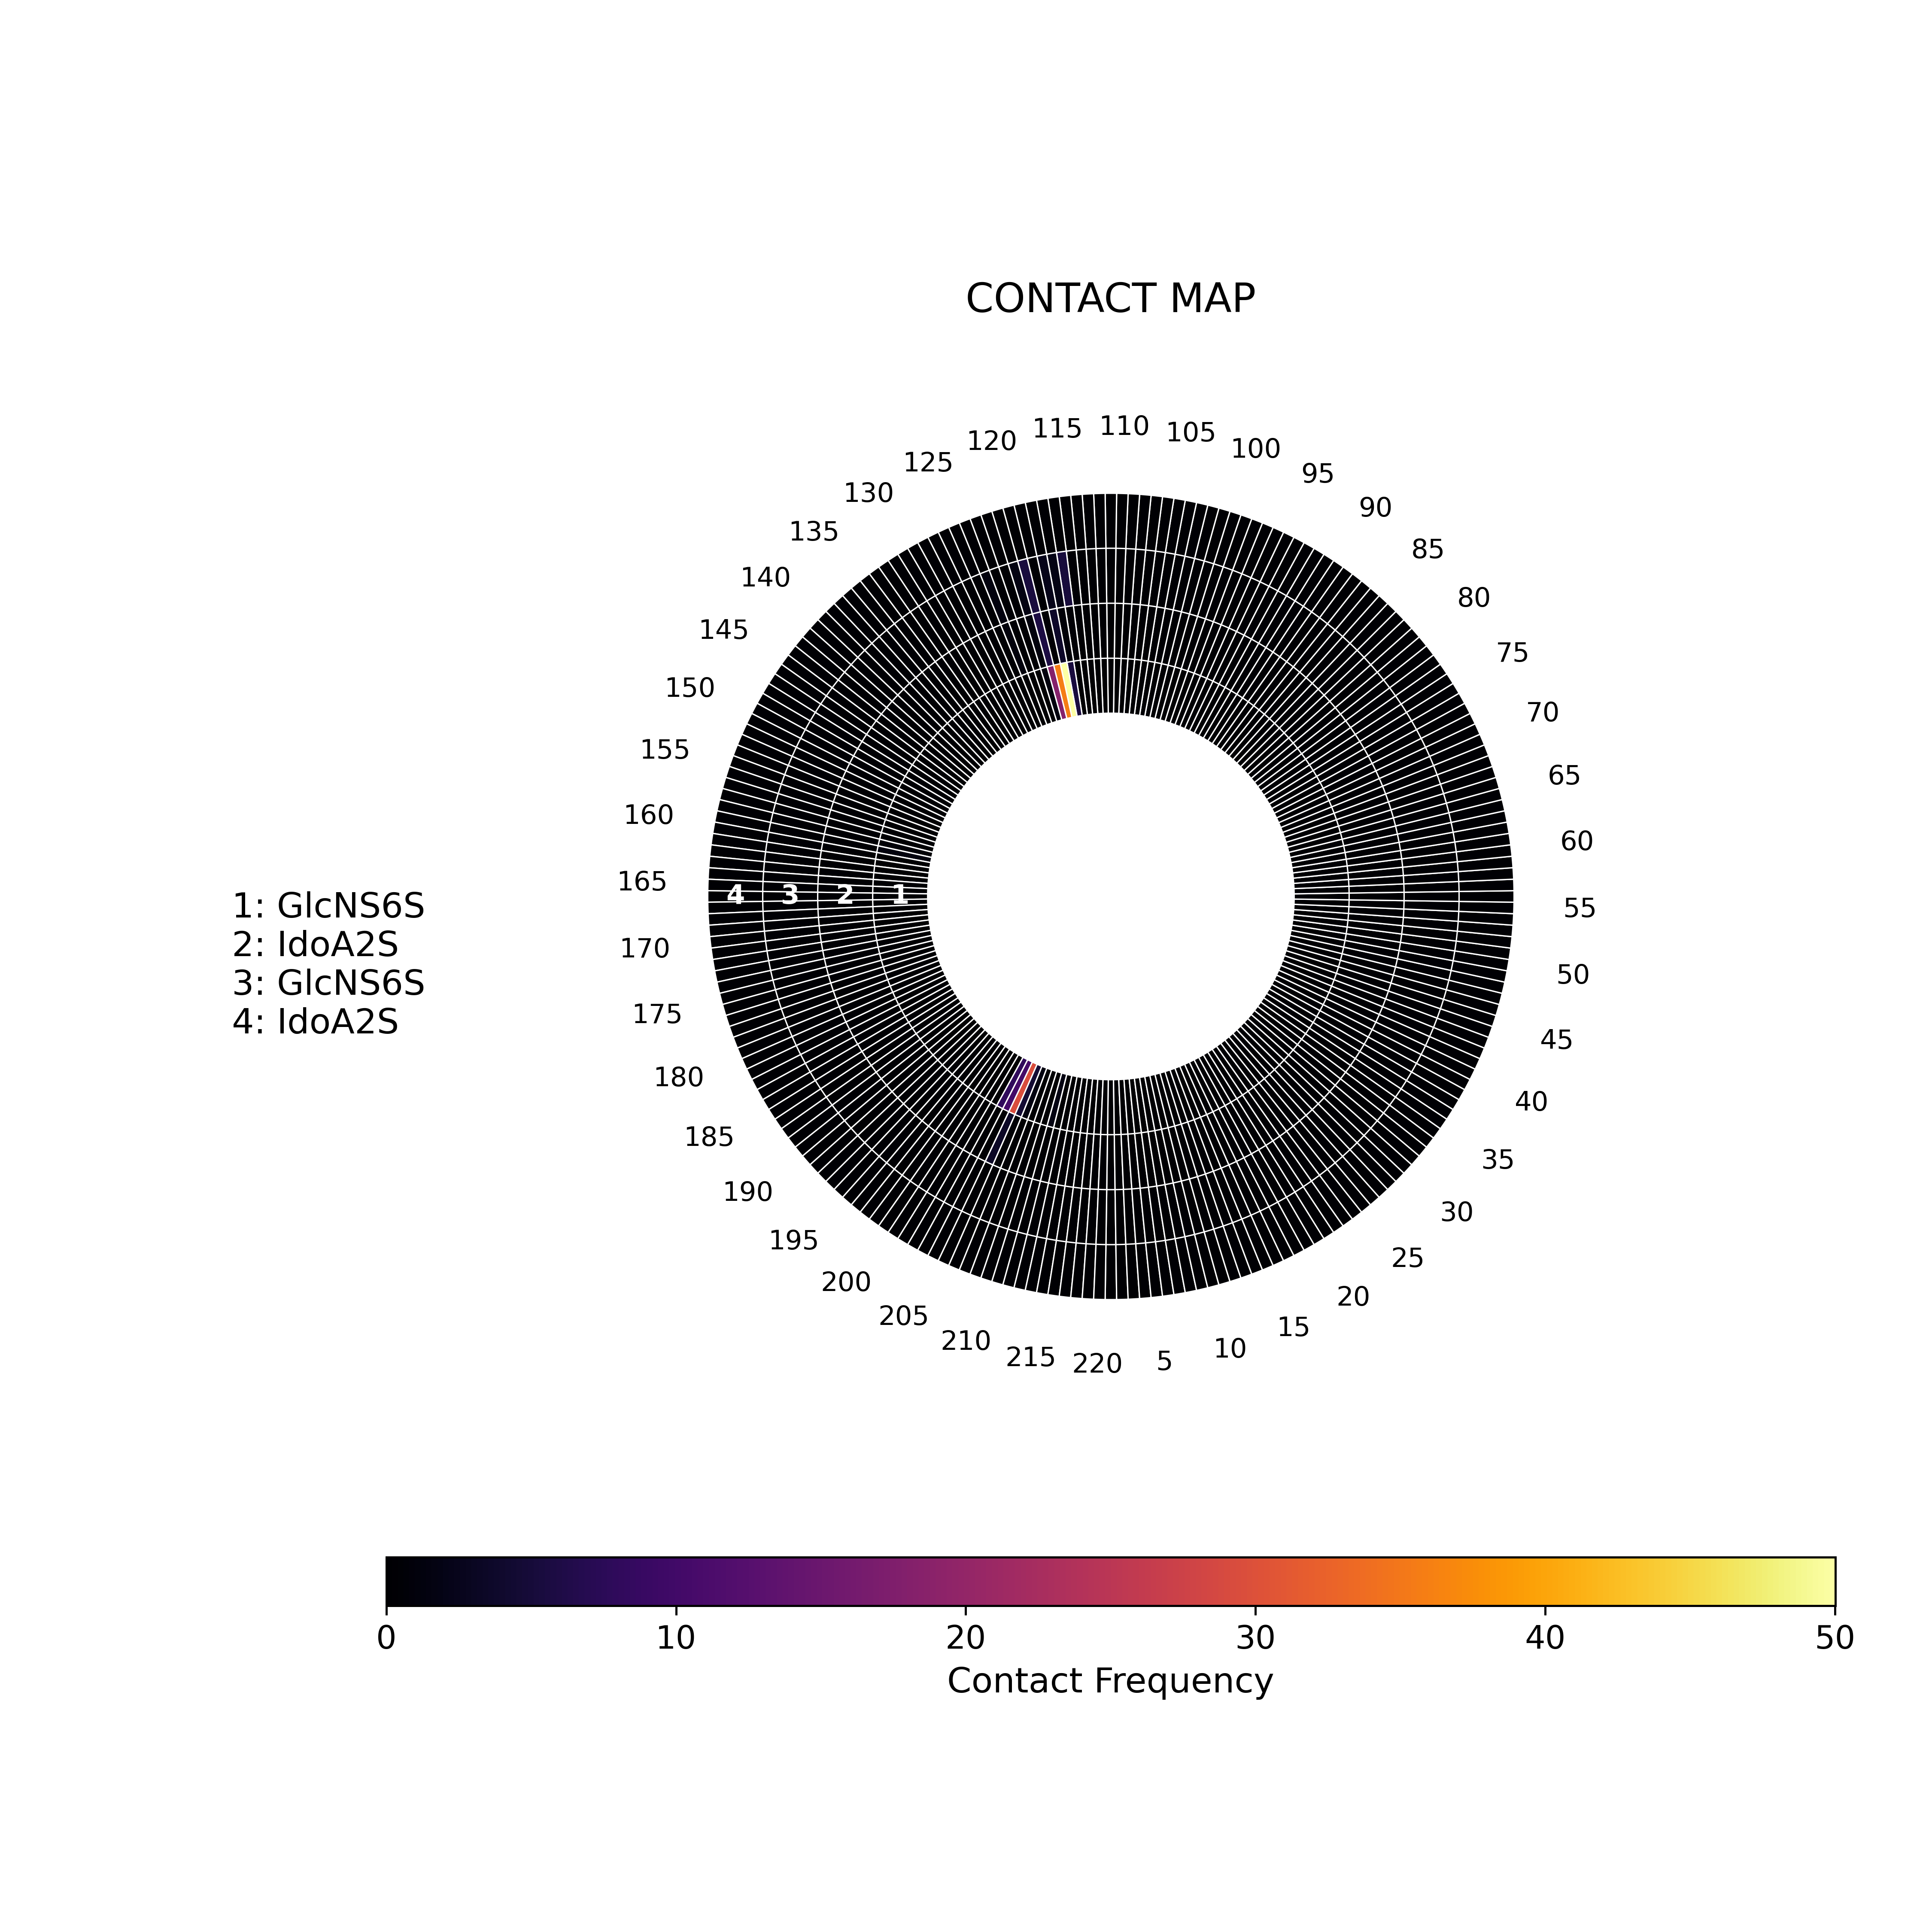
Contact maps
This section shows which protein regions remain in contact with the GAG during the molecular dynamics simulation.
Contact maps are graphical representations of contacts between atoms in protein complexes defined by the distance cut-off of 7 Å. The values in these 2D matrices are normalized, with 1 standing for contacts maintained through the entire molecular dynamics simulation and 0 indicating no interaction between atoms.
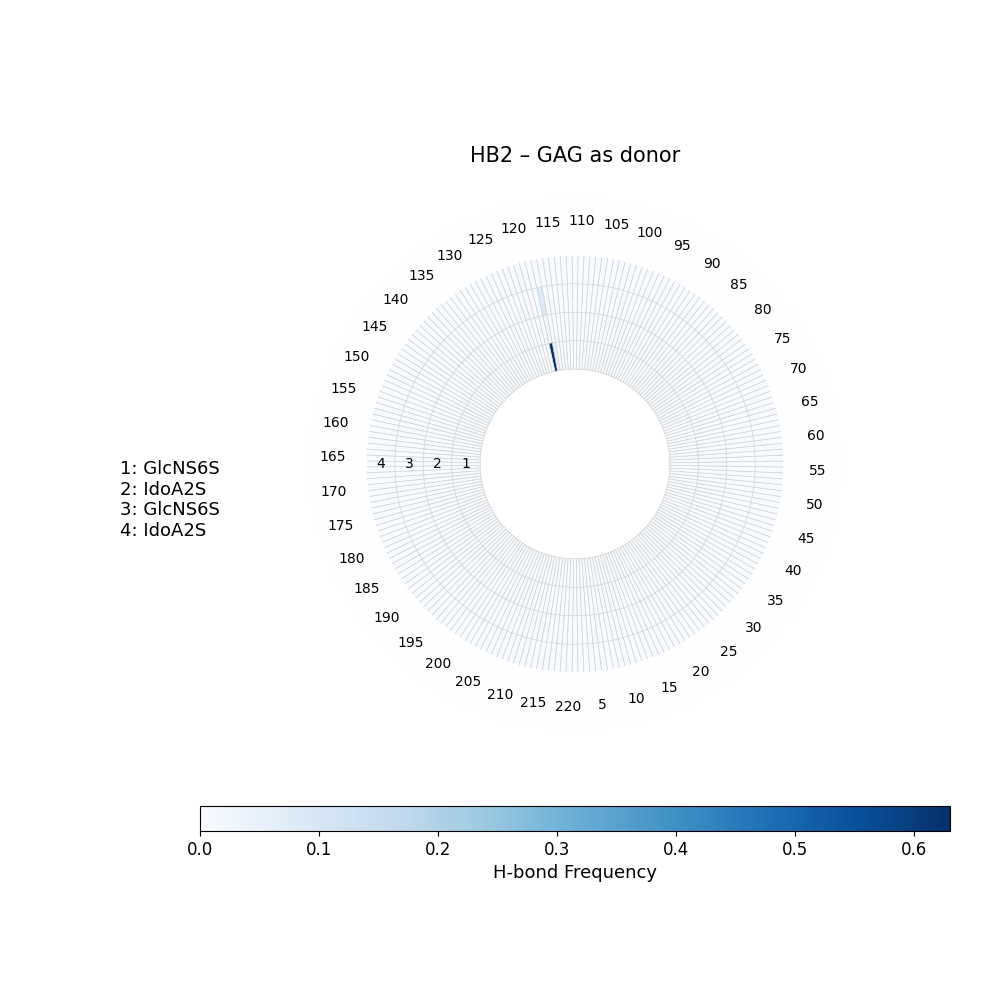
Hydrogen bonding — GAG as Donor
This section shows polar interactions that may stabilize contacts between the GAG and protein residues during simulation.
A hydrogen bond D-H----A, where D is a heavy atom covalently bound to the hydrogen, H is the hydrogen bond donor and A is a hydrogen bond acceptor, was defined by a distance cut-off of 3.0 Å between H and A and a cut-off of 135° for the hydrogen bond angle D-H-A.
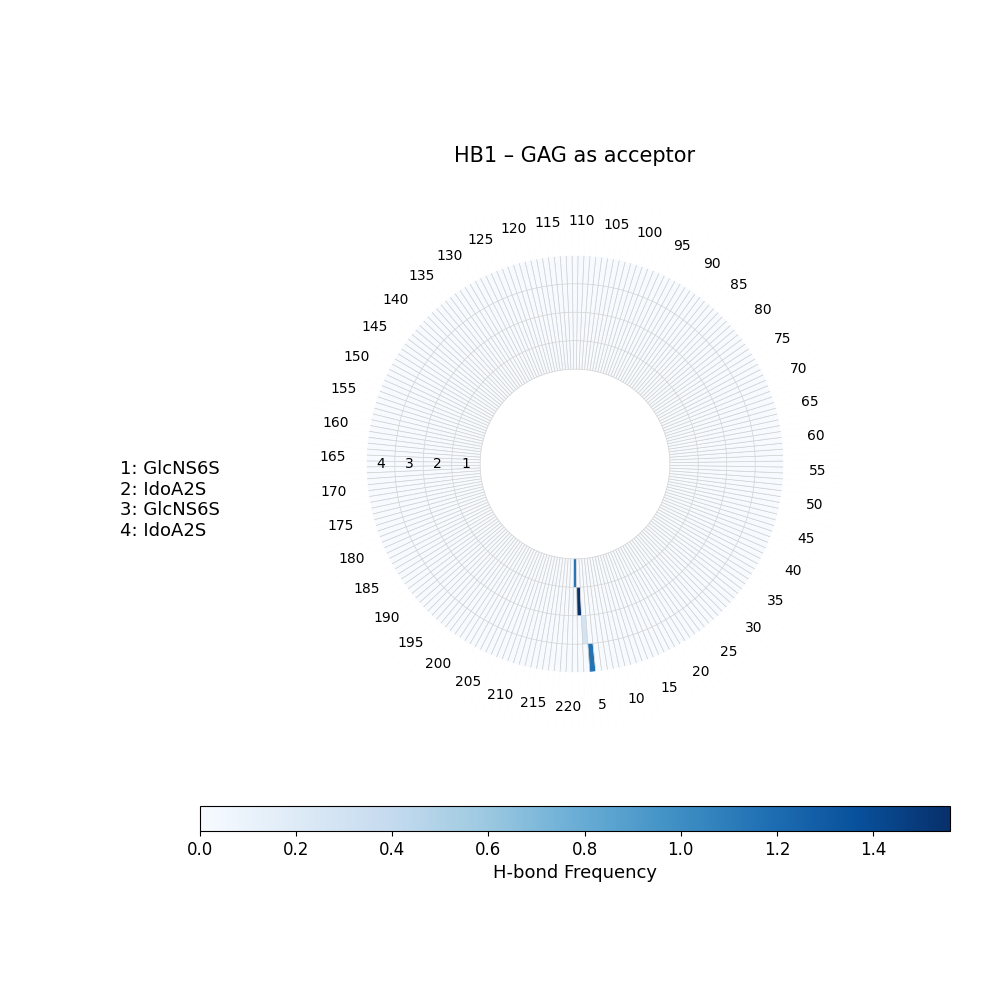
Hydrogen bonding — GAG as Acceptor
This section shows polar interactions that may stabilize contacts between the GAG and protein residues during simulation.
A hydrogen bond D-H----A, where D is a heavy atom covalently bound to the hydrogen, H is the hydrogen bond donor and A is a hydrogen bond acceptor, was defined by a distance cut-off of 3.0 Å between H and A and a cut-off of 135° for the hydrogen bond angle D-H-A.
Binding free energy contribution per residue
This section shows which protein residues contribute most favourably or least favourably to the estimated binding free energy.
The MM-GBSA approach allows free energy decomposition per residue to dissect which residues contribute the most and the least favourably to binding.
Per-residue decomposition is intended to support qualitative identification of potentially important GAG-recognition regions, not to provide exact experimental residue-level binding energies.
| Residue Node | Decomposition Value [kcal/mol] |
|---|---|
| Lys26 | -4.5 |
| Arg52 | -3.8 |
| His159 | -2.1 |
| Gln170 | -0.9 |
Download complete per-residue binding contribution table in CSV format:
Download Full Residues CSV